

The Housing Ledger: Vol. 1 - June 26, 2025
The Housing Ledger: Vol. 1 - June 26, 2025
Edd Hamzanlui
6/27/20257 min read
I would like to share a few headlines and a brief analysis of the Real Estate and [Housing] Development industry from the last few days. I hope you find them insightful.
In May 2025, Green Street’s Commercial Property Price Index (CPPI), which measures unleveraged transaction pricing for institutional-quality U.S. commercial real estate, rose 0.6% month-over-month and 4.1% year-over-year, indicating that pricing has remained largely stable thus far this year. Analysts attribute this steadiness to ongoing investor demand, though they note little further upside unless Treasury yields decline - a dynamic comparable to the relationship between cap rates and bond yields that drives valuation trends.
Key takeaway: Green Street’s CPPI remains resilient, signaling a firm transactional market for commercial properties - yet prospective gains may hinge on interest rate movements.
In Q1 2025, U.S. multifamily construction is increasingly shifting away from dense urban cores to lower-density areas - exurbs, small metros, and rural counties. Apartment starts in large metro core counties dropped from 45.1% in 2016 to 35.5%, the lowest share on record. This trend reflects developers targeting affordability and taking advantage of lower land costs, supported by demand from older renters seeking suburban lifestyles.
Cushman & Wakefield reports that the multifamily sector is navigating the recent surge in new apartment supply and ongoing economic uncertainty. However, investor interest remains, and Newmark reports that multifamily sales were up 35% from the prior year in the first quarter. Cushman & Wakefield's Sam Tenenbaum notes that:
"We're seeing a lot of rebounding in sentiment in the financial markets, which could permeate to the rest of the markets through the rest of the year."
National highlights
New apartment deliveries slowed, contributing to tight supply-demand dynamics - new supply accounts for just 0.72% of total stock.
Several other metro areas also rank highly: Suburban Chicago (85.1), Broward County, FL (85.0), Eastern LA (83.9), and Suburban Philadelphia & Manhattan (81.7).
Insight: Even with fresh inventory, persistent high demand - especially in top-tier, high-growth metro areas - is driving sustained renter competition and quick lease-ups.
1.7%: The annual decrease in multifamily asking rents in May, marking the 22nd consecutive month of annual rent declines, according to Realtor.com.
Yardi Matrix reported that despite economic uncertainty, average multifamily advertised rents climbed 1% on a year-over-year basis to hit $1,761 in May.
"Occupancy rates are slipping in some metros due to the heavy supply pipeline, but the drop is slow, as demand remains strong in high-supply metros."
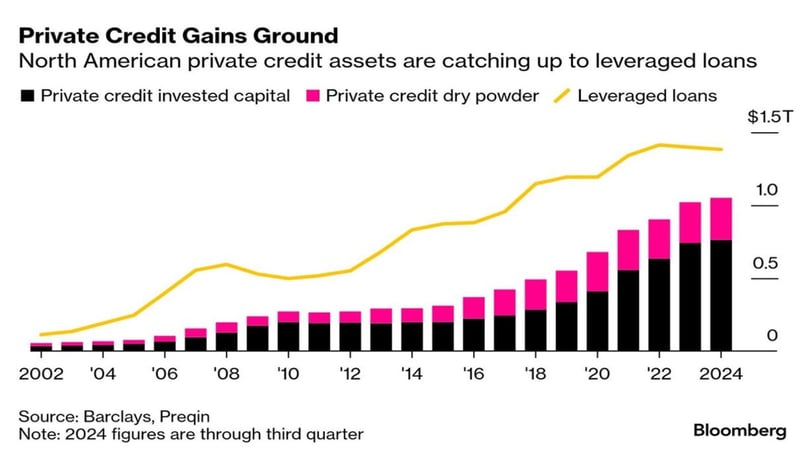
In April 2025, private equity firms owned over 2.2 million apartment units - representing about 10% of all U.S. rental apartments - spread across some 8,200 buildings. Blackstone leads with more than 230,000 units, followed by Greystar’s ~138,000 units. Over 60% of PE-owned units have been acquired since 2018, with 930,000 added after 2021. More than half are concentrated in Texas, Florida, California, Georgia, and North Carolina, with some metros - like Dallas/Fort Worth, Atlanta, and Tampa - seeing PE ownership exceed 25% of their apartment stock. This trend correlates with rising rent burdens and growing tenant complaints about rent hikes, fees, and poor maintenance in those markets.
REITs collectively own more than a million residential units across various segments, including manufactured and single-family homes, writes Nareit's Nicole Funari in June's sector spotlight. The recent boom in apartment construction has limited rent growth, but:
"Construction has since slowed, which should lead to a rebound in rents in the near future."
In Q1 2025, the U.S. multifamily sector recorded its strongest first-quarter performance since 2000, driven by exceptional renter demand and a slowdown in new supply. Net absorption hit 100,600 units, a 77% year-over-year increase. This combination suggests strong momentum and confidence returning to the multifamily market.
In May 2025, U.S. multifamily permitting edged up modestly - seasonally adjusted annualized rate (SAAR) reached 444,000 units (+1.4% month-over-month, +13% year-over-year) - while multifamily starts plunged 30% to 316,000 units SAAR, despite being up 5% from last year. Single-family permitting and starts remained flat to slightly down, reinforcing a trend of slowing single-family activity amid rising costs . Overall residential starts fell nearly 10% in May to 1.256 million units SAAR, with total permitting down 2% versus April and 1% year-over-year. These dynamics reflect a stabilized yet subdued pipeline for multifamily builds, while single-family momentum stalls.
A Senate Finance Committee proposal released in mid-June 2025 would make the Opportunity Zone (OZ) program permanent, replacing its current 2026 sunset with rolling 10-year designation periods beginning in 2027. Additional changes include expanded reporting requirements, funding to the IRS, and rural-focused incentives like relaxed improvement standards - but it excludes some House provisions like ordinary income investment allowances.
Republicans on the Senate Energy and Natural Resources Committee have issued draft legislation to sell up to 3.3 million acres of federal land to promote housing development and raise up to $10 billion. The draft also proposes increasing timber harvesting and allowing for more oil, gas, coal and geothermal leasing. In addition, it would claw back unspent climate and energy funding from the Inflation Reduction Act.
Mortgage
The average rate on a 30-year fixed mortgage rose to 6.88%, up from 6.84% during the prior week. Meanwhile, mortgage applications to purchase a home sank 0.4% from the prior week, although they were still up 11% from a year ago.
Homeownership
S&P Global CoreLogic Case-Shiller reports that US home price growth slowed to its lowest annual pace in nearly two years in April. Nicholas Godec, CFA, CAIA, CIPM of S&P Global Dow Jones Indices noted that:
"Markets that were pandemic darlings are now lagging, while historically steady performers in the Midwest and Northeast are setting the pace."
In May 2025, elevated mortgage rates (~6.8%) and economic uncertainty significantly weakened demand for new single‑family homes, causing sales to drop 13.7% to a seasonally adjusted annual rate of 623,000 - the lowest since October 2024. Despite 37% of builders offering incentives and price reductions, inventory climbed to a 9.8‑month supply, the highest since 2015, and builder confidence weakened.
"With mortgage rates close to 7% and home prices at all-time highs, the share of first-time home buyers as a share of all houses sold has declined from 50% in 2010 to only 24% today, see the first chart below. With fewer new households able to enter the housing market, affordability is putting upward pressure on rents, which is a problem for the Fed, see the second chart."
U.S. businesses and consumers are bracing for a difficult summer as uncertainty around. Although May brought stable job growth (~139,000 new jobs) and steady unemployment (4.0–4.2%), capital investment and hiring plans have stalled amid policy volatility. Firms like UltraSource and Titan Steel report profit pressures and procurement challenges due to sudden tariff spikes. The OECD - OCDE now projects slower U.S. economic growth - down to 1.6% in 2025 - with inflation picked up as tariffs raise production costs. Financial markets are on edge, given high Treasury yields and consumer price concerns, while the housing market shows signs of weakening.
Some homeowners who purchased at the height of the pandemic buying frenzy now face declining home values. In a small but growing number of cases, buyers may owe more on their mortgages than these homes are worth, especially in places such as Austin, Texas, and Cape Coral, Fla. Being underwater on a mortgage may not have a major impact on a person's daily financial life, but it may limit home sales.
Home sales at lowest May levels since 2009
New Home Sales: Sales of new single-family houses in May 2025 were at a seasonally adjusted annual rate of 623,000. This is 13.7 percent (+/- 13.1%) below the revised April 2025 estimate of 722,000.
May 2025: -13.7 % Change
April 2025 (r): +9.6* % Change
The number of buyers exceeded the number of sellers in the US housing market by half a million in April, according to Redfin, marking the largest such gap in data stretching back to 2013. The market remains subdued despite the influx of sellers, although some are offering concessions or cutting prices to spur deals.
In Q1 2025, outstanding 1–4 family (single‑family) construction and land development loans in the U.S. rose modestly on a quarterly basis (to $90 billion), marking the first increase in two years - even as total AD&C loan balances fell 4.1% year-over-year to $478.3 billion. However, delinquencies grew too: roughly $1.2 billion of these loans were 30+ days past due or non‑accrual - a 24% rise from a year earlier and the highest rate since 2015 - though this still represents only about 1.4% of the total volume.
Construction
In May 2025, the U.S. Producer Price Index for new residential construction inputs rose 0.2% month-over-month, rebounding from April’s decline, and was up 1.9% year-over-year. Goods (mainly building materials) increased 1.6% annually, while services rose 2.3%. On a monthly basis, energy-input prices climbed 0.8%, materials by 0.1%, and service inputs by 0.3% - highlighting modest but persistent cost pressures in homebuilding. For broader inflation context, U.S. wholesale (PPI) prices rose 2.6% year-over-year in May, with mild 0.1% monthly gains - suggesting inflation remains contained despite trade and tariff uncertainties.
Construction Spending: Total construction activity for April 2025 ($2,152.4 billion) was 0.4 percent (+/-0.7 percent)* below the revised March 2025 ($2,162.0 billion).
April 2025: -0.4* % Change
March 2025 (r): -0.8* % Change
New Residential Construction: Privately-owned housing starts in May 2025 were at a seasonally adjusted annual rate of 1,256,000. This is 9.8 percent (+/- 9.3%) below the revised April 2025 estimate of 1,392,000.
May 2025: -9.8 % Change
April 2025 (r): +2.7* % Change
In April 2025, U.S. private residential construction spending declined 0.9%, marking the third straight monthly drop—driven by a 1.1% reduction in single-family construction and a 0.8% decline in home improvement spending. Multifamily investment edged down 0.1%, continuing its slide since December 2023. Overall, total residential spending fell 4.8% below the level of one year ago, reflecting ongoing pressures from rising interest rates and tariff-related uncertainty.
In Q1 2025, U.S. sawmill capacity utilization fell to 64.4%, with production stagnant despite increased installed capacity - especially following 2023 gains. Domestic employment also slipped for a third consecutive quarter. While the U.S. has sufficient timber resources to replace Canadian lumber imports, significant barriers remain, including limited mill infrastructure, logistical challenges, labor shortages, and regulatory hurdles - suggesting that self-sufficiency is feasible but far from imminent.
The National Association of Home Builders (NAHB)/Wells Fargo Housing Market Index, a measure of homebuilder sentiment, fell to a reading of 32 in May. Elevated mortgage rates and other factors are weighing on the market. Here are the readings for the three HMI indices in June:
Current sales conditions fell two points to 35.
Sales expectations in the next six months dropped two points lower to 40.
Traffic of prospective buyers posted a two-point decline to 21.
Boston
A report from Tufts University and the Boston Policy Institute, Inc notes that Boston's office buildings could lose up to 45% of their value by 2029, potentially leading to a cumulative tax revenue loss of $1.7 billion. The city is especially exposed to the downturn because about a third of its revenue comes from commercial property taxes.

